BBSIGMA
  • Home
  • About
  • Dow Theory
  • CMBT Theory
  • Showcases
  • Contact

How to read the BB Sigma Index (Yin-Yang Index)


Chart Reading Example
BAC Intermediate Yin-Yang Index
Part 1: Center
Picture
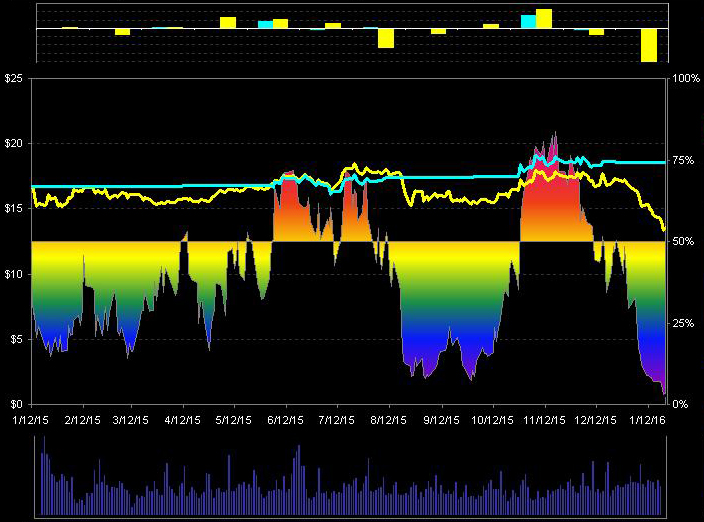
1. Middle part is the main chart.
  • Left scale is the price of BAC stock and shown as yellow price line on the chart;
  • Right scale is the Yin-Yang Index value from 0% - 100% with 50% as the Yin-Yang crossing point;
  • Color shaded chart is the Yin-Yang value over one-year period with time range shown below;
  • The blue line shown is the actual trading price line based on the Yin-Yang crossing as trade signal;
2. Top part is the monthly performance relative comparison for buy-hold strategy (yellow) vs. Yin-Yang trading (blue) which show all five down months could have been avoided with Yin-Yang trading.
3. Bottom part illustrates the daily volume.

Part 2: Top
Picture
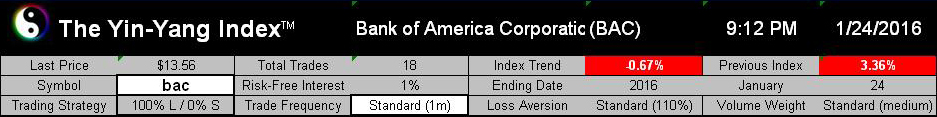
  • Top right shows the time and date when the Yin-Yang Chart is created;
  • "Last price" is the last trade price for BAC ($13.56);
  • "Total trades" shows how many trades are made when applying the Yin-Yang Trading strategy (18);
  • "Index Trend" gives the Yin-Yang Index Change when the current index is compared to yesterday's index (-0.67% or getting more bearish);
  • "Previous Index" is yesterday's closing Yin-Yang Index value (3.36%);
  • "Symbol" field can enter any stock ("BAC" shown here) or ETF symbol to obtain the real-time Yin-Yang Index Chart;
  • "Risk-Free Interest" is the interest assumed for cash parked when Yin-Yang trading is in action;
  • "Ending Date" is the input for the one-year chart ending date which is normally set as current date;
  • "Trading Strategy" is set default as 100% long based on Yin-Yang crossing and it can be set as long/short strategy to increase leverage;
  • "Trading Frequency" here is set as Standard which will give Intermediate Trend chart (Long-Term Trend uses "Years" and Short-Term Trend uses "Days");
  • "Loss Aversion" setting is 110% which means investors is 10% emotional overweight to loss vs. gain;
  • "Volume weight" can be changed to overweight or underweight volume effect on the Yin-Yang Index value.
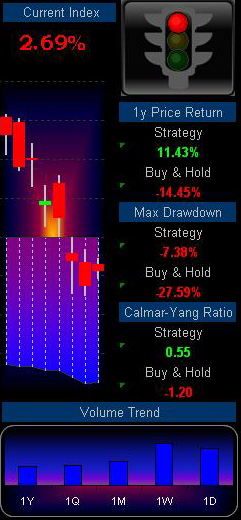
Part 3: Right
Picture
  • "Current Index" is the real-time value of the Yin-Yang Index when the system is running;
  • The chart below the Current Index is the zoomed-in view of the main Yin-Yang chart for the last eight days with the BAC price candle chart shown as well;
  • Traffic Light gives easy ready of the Yin-Yang crossing as a trading indicator (red; yellow; and green) with Yellow to show the Index value is in the range of "45% - 55%" and the trend reversal may be coming;
  • "1y Price Return" shows actual one year performance for the Yin-Yang Strategy (using Yin-Yang crossing to trade) vs. Buy-and-Hold;
  • "Max Drawdown" gives the peak to bottom happened during last 12 months for the Yin-Yang Strategy vs. Buy-and-Hold;
  • "Calmar-Yang Ratio" is a new uniformed performance measurement ratio developed by Dr. Charlie Q. Yang.  A larger positive ratio meaning the strategy is better than risk-free investment with good risk-reward trade-offs;
  • "Volume Trend" illustrates the most recent year, quarter, month, week and day's volume change trend.

Part 4: Bottom
Picture
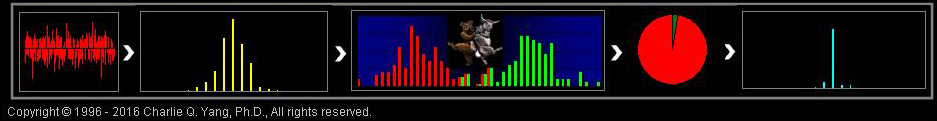
  • The left part (red noise chart) is the actual statistical sampling of the BAC trading price changes;
  • The Yellow single-mode bell chart shows traditional way of presenting the price changes to calculate mean (return) and standard deviation (risk);
  • The middle red/green chart is the resulting dual-mode distribution after statistical processing using the CMBT Theory;
  • The Pie chart shows the resulting Yin-Yang calculation which illustrates the Yin (bear) is clearly in control for BAC stock (most in red);
  • The right blue chart with a narrow single-mode chart shows if the Yin-Yang Strategy is applied, the resulting return/risk is much better than the Buy-and-Hold strategy (shown in the yellow single-mode chart).

BACK TO TOP
Disclaimers: YYindex,com is sponsored by Institute for Systematic Investment Research (ISIR). Its ongoing research results, statements, and statistics are believed to be reliable but are not guaranteed as to accuracy, timeliness, or completeness. We do not endorse, recommend, or comment any specific financial firms and/or their products or services. The past performance cannot guarantee its future performance. You bear full responsibility for own investment decisions which may be influenced by ISIR's research or information. You also agree that ISIR and any of its staffs will not be liable for any investment decision made or action taken by you.
Copyright: All Information available through this site is protected by copyright and intellectual property laws. All rights reserved. You may not reproduce, re-transmit, disseminate, sell, publish, broadcast, nor shall the Information be used in connection with creating, promoting, trading, marketing investment products without the express written consent of Institute for Systematic Investment Research (ISIR). You are entitled to use the Information it contains for your private, non-commercial use only.
Systematic Investing Research and Education since 1996
  • Home
  • About
  • Dow Theory
  • CMBT Theory
  • Showcases
  • Contact