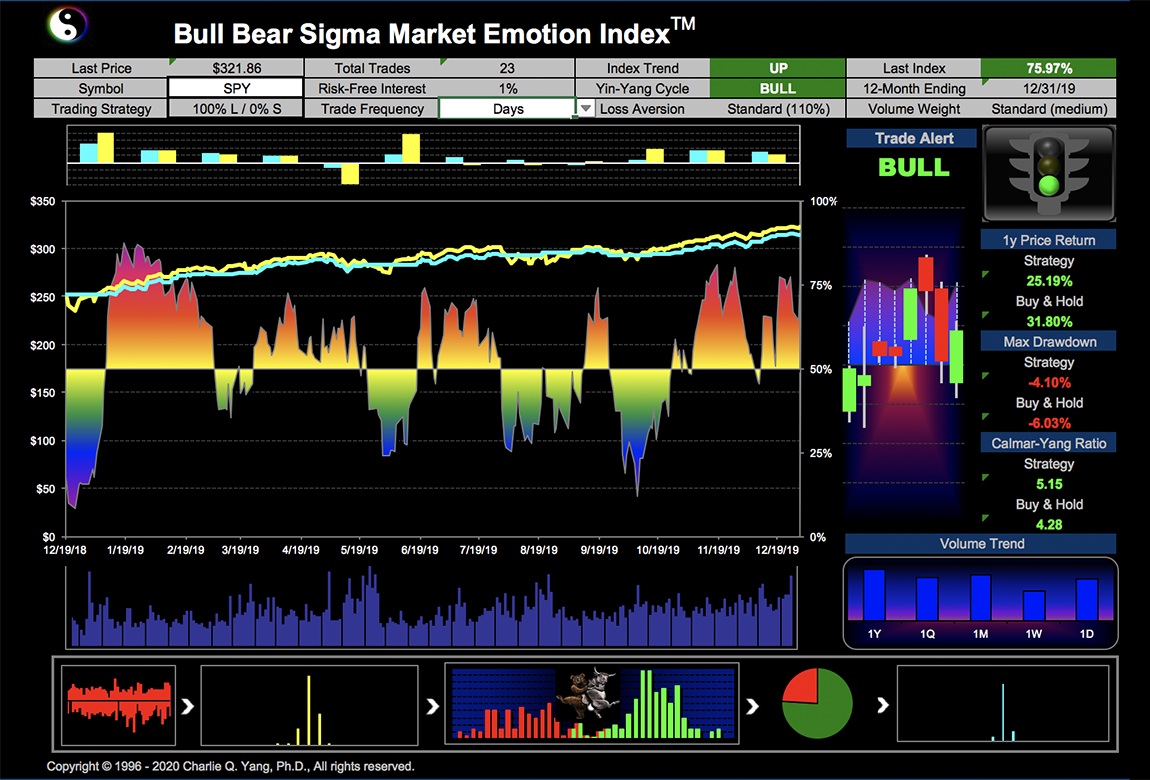
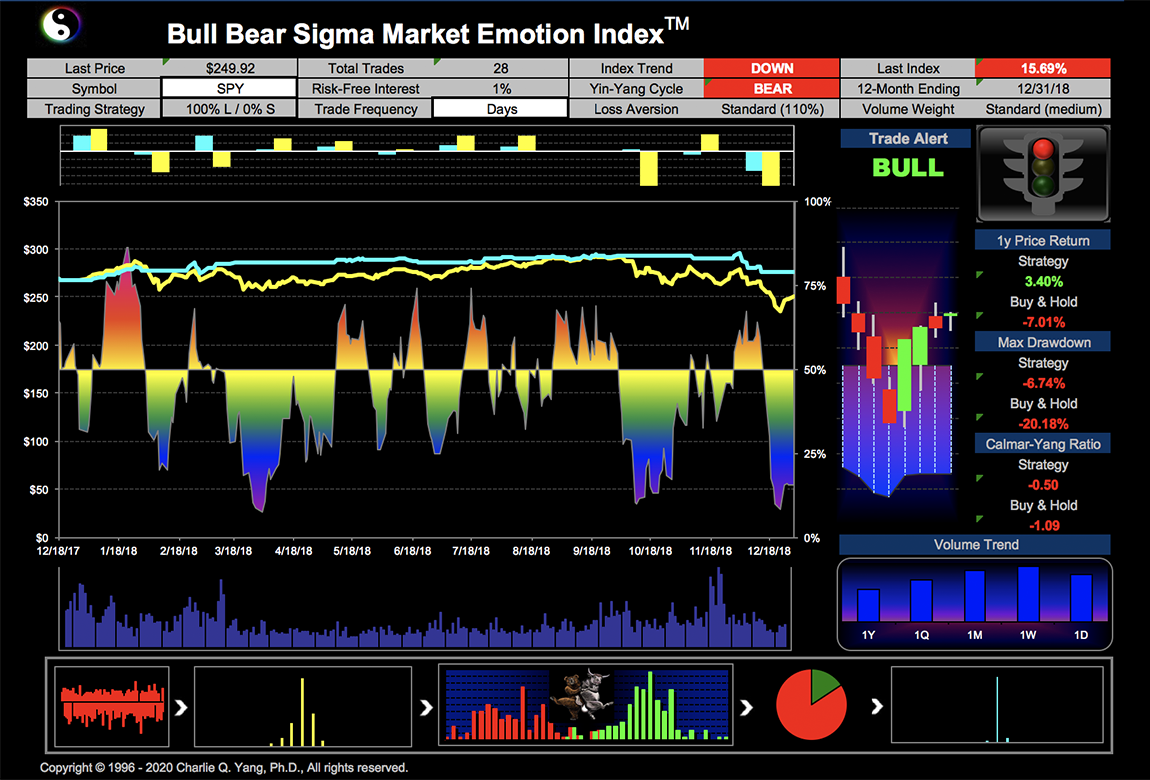
S&P 500 Market Trend BB Sigma Index*
(Primary/Secondary/Minor)
*Note: Also known as Yin-Yang Index and used for CMBT theory validation
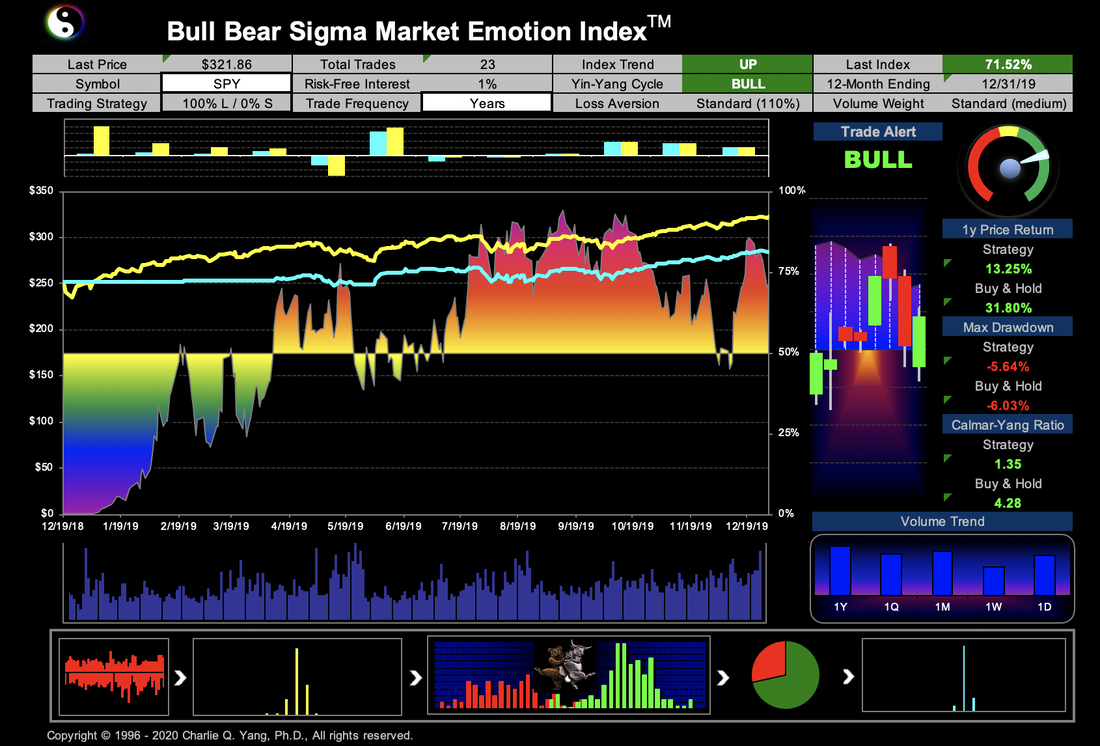
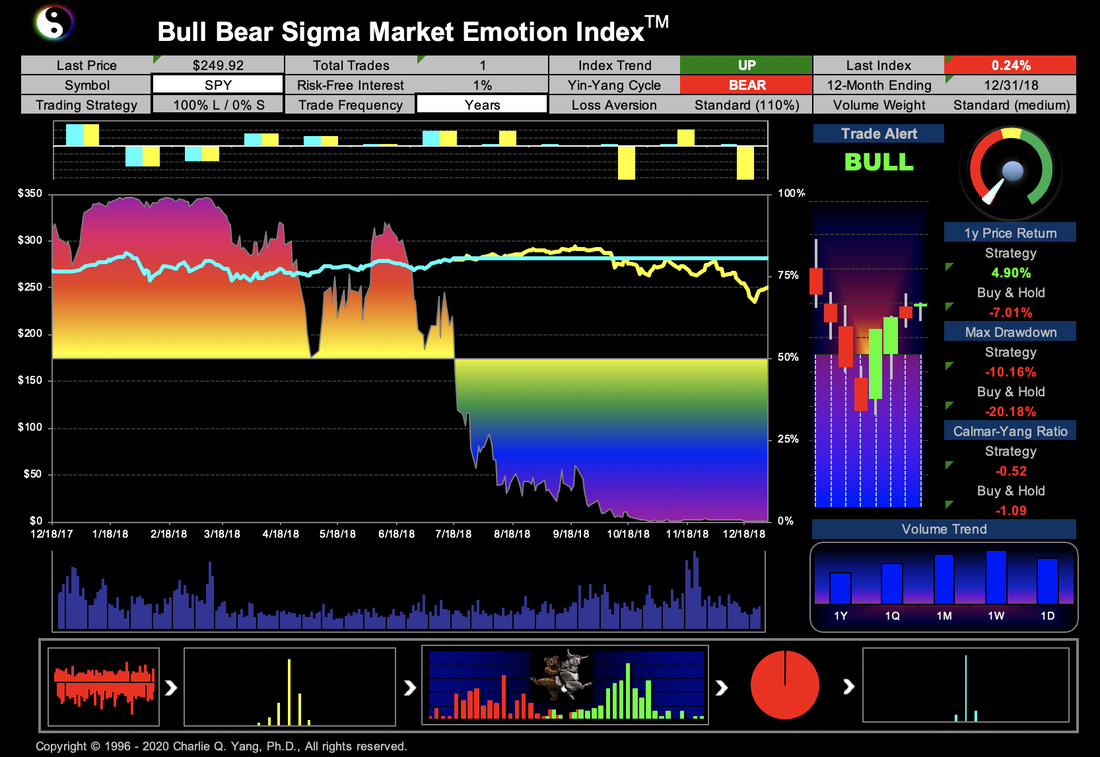
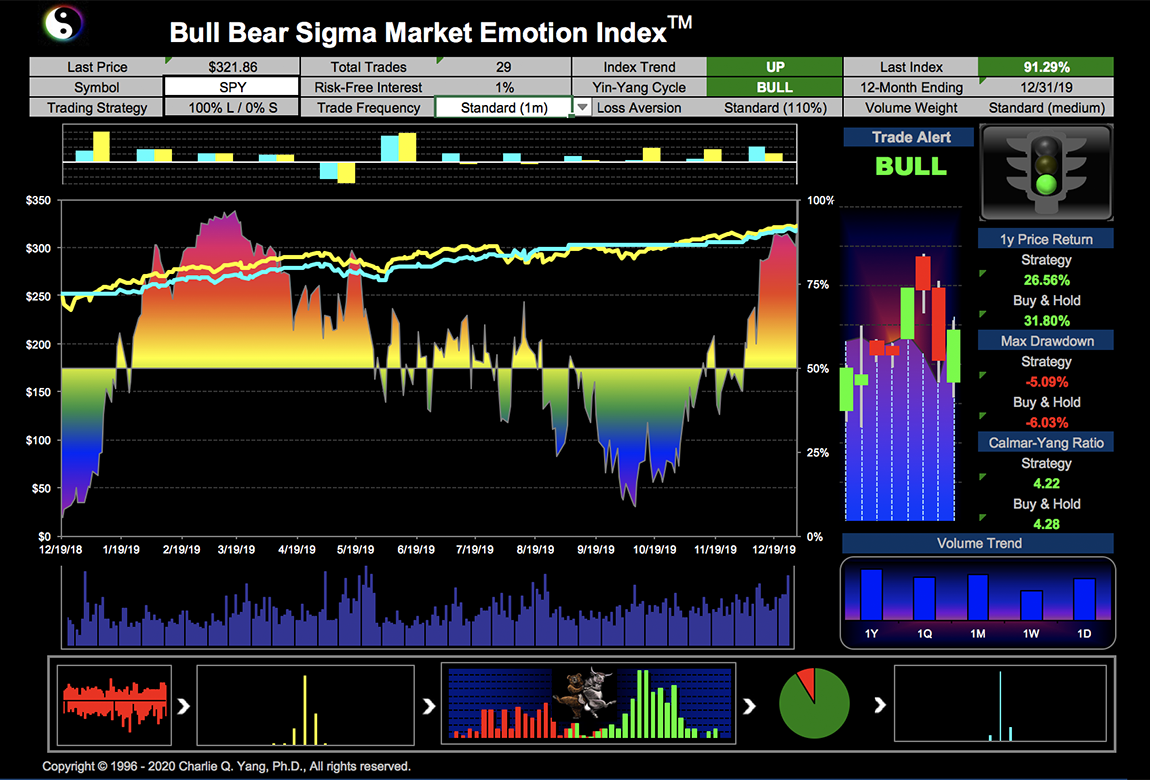
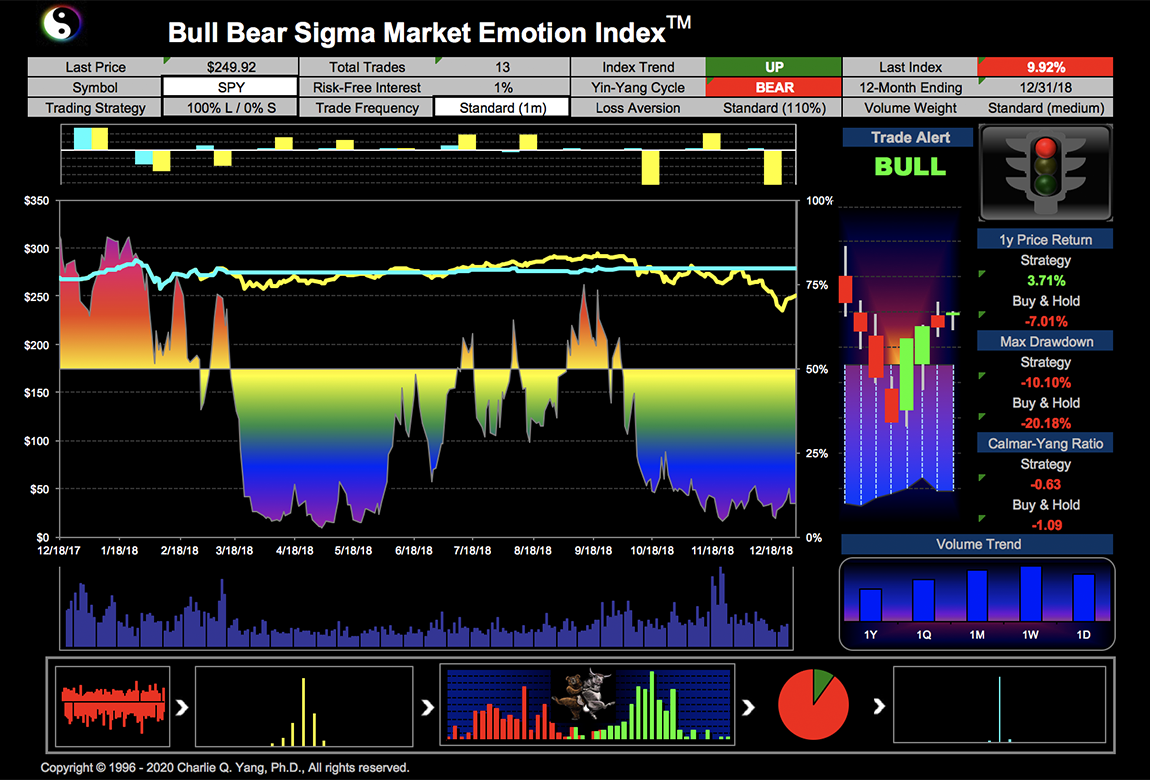
Examples of Monthly Yin-Yang Index Charts (2016 Election Year)
|
|
|
|
Simple Trend Ratings System
Bearish (down), Bullish (up), Neutral (flat)
Long-Term (>1 year), Mid-Term (3 - 12 months), Short-Term (< 3 months)
Long-Term (>1 year), Mid-Term (3 - 12 months), Short-Term (< 3 months)
Yin-Yang Index is different from other technical and fundamental indicators:
- Technical analysis indicators are based on prices
- Fundamental analysis indicators are based on financials
- Yin-Yang Index is based on real-time investor behaviors (it is NOT based on prices or financials for calculations, it is 100% based on capital market actions)
- CNN's Fear & Greed Index does not give trend detection and trade signals; and has not been scientifically proven nor systematically validated
- Yin-Yang Index gives cycle detection and reversal signals in real time; and has been scientifically proven and systematically validated (up-to-date report available upon request)
The New Scientific System for Capital Market Cycle
Reversal Signal Detection and Prediction*
Reversal Signal Detection and Prediction*
* The stock market trend switches from quantitative change to qualitative change. The unpredictable future significant forces (various events such as political policy change) can trigger the change transition. The stock market trend continues during the quantitative phase. It can be detected when the transition to the qualitative phase happens. The process of quantitative change occurs when the economic cycles are gradually improving (bull) or deteriorating (bear) without significant (material) new forces (events).
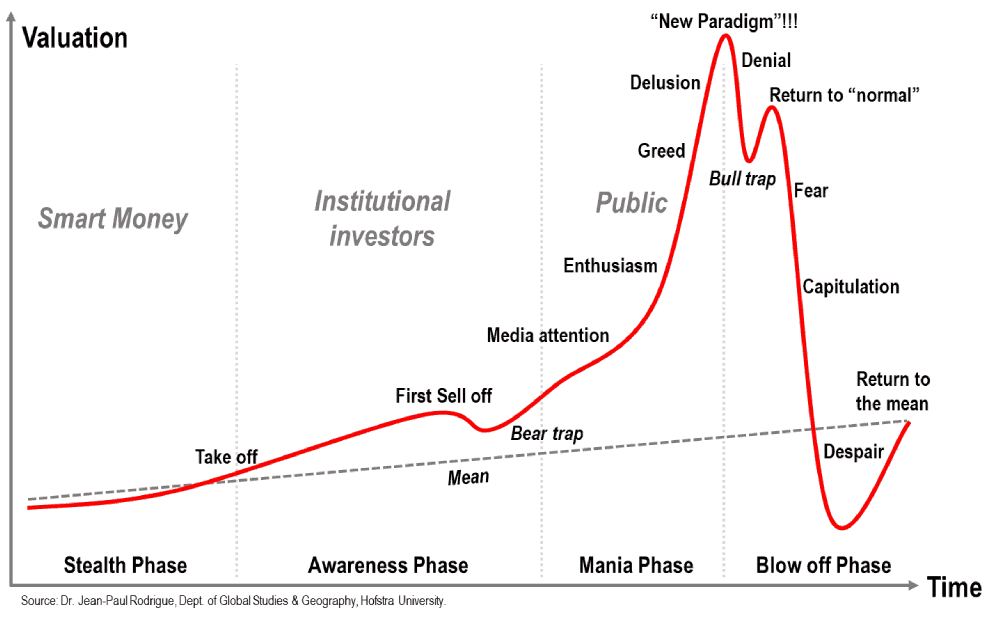
According to Dr. Charlie Q. Yang's Capital Market Behavior Theory (CMPT), the stock market trend reversal happens where the overall bullish force overtakes the overall bear force in controlling the market direction, or vice versa. The feasibility and justification of such a detection or prediction power are simple. Except for sudden significant events, the stock market price movement has multiple phases driven by the money flows with various smart levels. Smart money trades early, and public money always acts the last (see chart below).
According to Dr. Charlie Q. Yang's Capital Market Behavior Theory (CMPT), the stock market trend reversal happens where the overall bullish force overtakes the overall bear force in controlling the market direction, or vice versa. The feasibility and justification of such a detection or prediction power are simple. Except for sudden significant events, the stock market price movement has multiple phases driven by the money flows with various smart levels. Smart money trades early, and public money always acts the last (see chart below).
Process of Deriving BB Sigma Index (Yin-Yang Index)
Step 1: The intra-day trading actions for a given stock (or ETF) are sampled by measuring up-ticks and down-ticks weighted with market order volumes;
Step 1: The intra-day trading actions for a given stock (or ETF) are sampled by measuring up-ticks and down-ticks weighted with market order volumes;
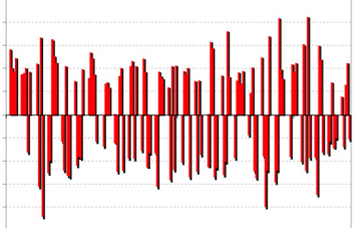
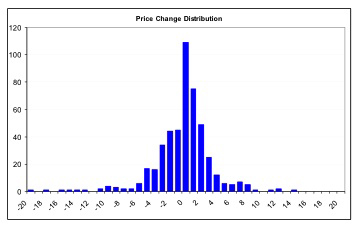
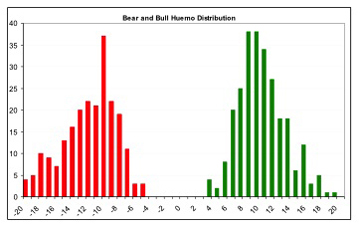
Step 2: The resulting statistical samples over a defined period is captured as random noises, and then processed into single-mode price normal distribution, and dual-mode bull/bear distributions as shown.
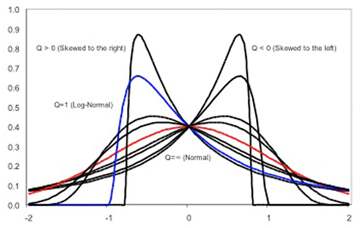
Step 3: Dual-mode distribution is then modeled by Q-Distributions with optimized Q calculated.
Step 4: The BB Sigma Index (Yin-Yang Index) is derived with additional steps of normalization and incorporates other parameters for complete presentation to create the final Yin-Yang Index chart.
Timeline of BB Sigma Index (Yin-Yang Index) Discovery
The BB Sigma Index (Yin-Yang Index) is all about measuring market psychology. It has been undergoing over 20 years of scientific development and real-time engineering validation:
Prior 1994:
The BB Sigma Index (Yin-Yang Index) is all about measuring market psychology. It has been undergoing over 20 years of scientific development and real-time engineering validation:
Prior 1994:
- The oversimplified assumptions in the Modern Portfolio Theory (MPT) were questioned.
- The Normal distribution (bell-curve) as the foundation for calculating investment returns, risks, Alpha, and Beta were challenged
- Discovery of Q-Distribution by Dr. Charlie Q. Yang to extend the versatility of Normal distribution assumed by MPT
- Development of CMBT Theory by Dr. Charlie Q. Yang to expand the principles of the Dow Theory
- Implementation of the Yin-Yang Index system to measure the capital market sentiment in real-time
- Statistical validation of the BB Sigma Index (Yin-Yang Index) as a concurrent indicator using real-time market data
- Theme-based Benchmarks based on the CMBT Theory are constructed to improve the traditional market-index based benchmarks. A set of new standards is developed for investors to measure the added-value, if any, of actively managed portfolios.
20 Years of S&P 500 Annual BB Sigma Index (Long-Term Yin-Yang Index) Charts

